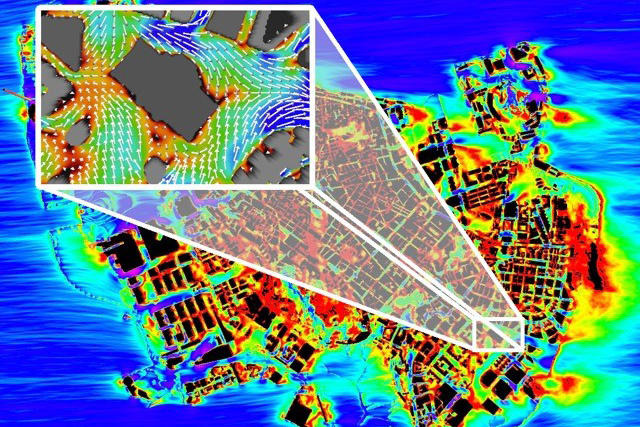
The diagram shows a PALM simulation of the climate in Macau peninsula – poor ventilation is shown in red, good ventilation in blue. PALM provides the basis for the new urban climate model.
Bildquelle: Leibniz Universität Hannover, Institute of Meteorology and Climatology; Maronga and Gronemeier 2016.